 Evolution
 Intelligent Design
Vincent Torley Thinks I Have Egg on My Face
Well, I must say I didn’t expect to be honored by a 7500-word broadside by philosopher Dr. Vincent Torley, assisted by Dr. Josh Swamidass, Assistant Professor at Washington University. I guess they must have a lot of spare time. The reason for the post at Uncommon Descent? Both hold common descent to be absolutely, incontrovertibly, obviously true, and they apparently wish I would fall into line and stop embarrassing them by doubting common descent. They wish I would give up my “peculiar kind of intellectual obstinacy.”
The argument is in the end all about common descent. (There are a few accusations of poor reasoning, obscuring the issue, and even a little bad faith along the way.) Look, intelligent design is not wedded to common descent. Neither is it wedded to a denial of common descent. Intelligent design states that there is evidence of design in the universe. I think we are in agreement on this point. In terms of biology, how the designer instantiated that design is still subject to debate, based on the strength of the evidence for each position.
As a biologist, I see evidence on both sides of the debate. The evidence is equivocal — hence the fact that ID advocates take different positions on the subject. Yet common descent — the idea that organisms descend from one or a few common ancestors — is treated like a sacred cow by many scientists, and even, it appears, by some philosophers. Indignation arises that anyone would doubt it, would even have questions. Scientists take common descent as axiomatic, and accept evidence that is itself interpreted through a lens of common descent as proof of common descent. As a consequence, any evidence against common descent meets opposition and is explained away.
So when I see weak evidence for common descent I say so, as I did in a post here, “The Vitellogenin Pseudogene Story: Unequally Yolked.” (Apparently Dr. Torley caught the reference but missed the yolk, as he repeatedly misstates my post’s subtitle as “Unequally Yoked.”) I wrote the aforementioned post because of weak evidence, and even an overstatement of the evidence by some.
The controversy began with the post on vitellogenin synteny, “Vitellogenin and Common Ancestry: Reading Tomkins,” by Professor Dennis Venema at Trinity Western University, where I read some interesting arguments regarding cross-species synteny in the region of the chicken vitellogenin genes. Synteny is the term for the shared arrangement of genes along chromosomes from different organisms, and its existence is taken as evidence for common descent. Vitellogenins are egg yolk proteins, present and used in egg-laying organisms.
I followed up by reading the paper “Loss of Egg Yolk Genes in Mammals and the Origin of Lactation and Placentation,” by David Brawand, Walter Wahli, and Henrik Kaessmann, on which Venema’s post was based. (It’s free access. You can verify all this yourself.) It’s always a good idea to read the original material and evaluate the evidence for yourself. What I saw in Brawand et al. is what prompted me to write my post.
My dispute with Torley (and Venema) is at bottom a dispute about the scientific interpretation of data, or should be. Therefore I am going to go through the data in some detail, to show why I reached the conclusions I did with regard to the human “VIT1” pseudogene, and where we differ in interpretations. This essentially covers Torley’s points 1 and 2. I will address the points 3-7 in later posts, so as not to burden the reader with excess length.
There are three chicken egg yolk genes, VIT1, VIT2, and VIT3, all expressed and made into protein because chickens lay eggs. The Brawand paper set out to see if there was any evidence for a vitellogenin presence in the human genome, with the idea that we are descended from an egg-laying animal. They looked in the region of our chromosome that is analogous to the chicken genome, and aligned the two against each other. A dotplot from the Brawand paper (see below) shows where the human (Y axis) and chicken (X axis) DNA sequences align. A perfect alignment (for example if human sequence was aligned against human) should show a diagonal solid line.
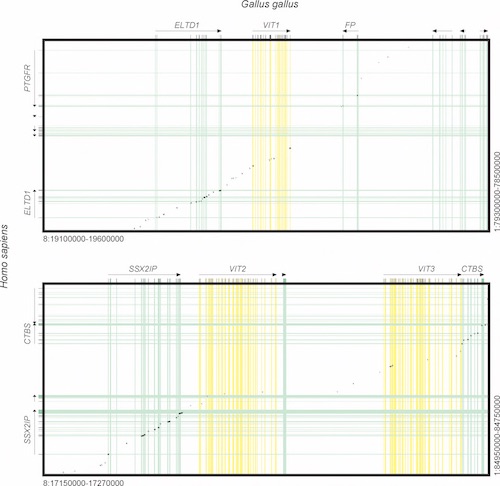
All figures taken from Brawand, D., Wali, W., and Kaessmann, H. 2008. Loss of Egg Yolk Genes in Mammals and the Origin of Lactation and Placentation. PLoS Biology (6) 507-517. Creative Commons license.
The top panel illustrates the VIT1 alignment between the two sequences, chicken and human, and the bottom panel VIT2 and VIT3. Black dots show where sequence similarity exists. The colored stripes indicate coding sequences (exons) for each “gene.” In between in the white regions are the non-coding introns and intergenic spaces (sequences between genes). ELDT1, FP, SSX2IP, and CTBS are functional genes in both human and chicken and show sequence similarity and synteny in all coding sequences (the yellow stripes). Even some intergenic spaces show evidence of synteny. Where the synteny disappears is where the VIT1, VIT2, and VIT3 coding sequences should be.
I found the VIT1, VIT2, and VIT3 alignments to be ambiguous at best. However, in the supplemental materials for the Brawand paper is another representation of the syntenic regions where the human VIT1, VIT2, and VIT3 remnants should be. That makes things clearer. It is reproduced below, but click on the image to see the figure properly:

The bars colored red and black represent the chicken VIT genes, showing only their exons (the parts of the gene that contribute to making protein), alternating as red and black segments along the VIT sequences. (There are 35 exons in VIT1 and 2, 36 exons in VIT3.) Above each bar and running parallel to it are thin red lines, indicating where similarity has been detected, with insertions, deletions and stop codons necessary to make the sequence line up also indicated. To find this alignment they used “highly sensitive similarity search algorithms,” and ran repeated trials. From the paper:
The best scoring alignment chain was determined from the 2,000 best local alignments for each VIT region using dynamic programming. Importantly, the combined alignments of VIT coding sequences of the best chain for each of the opossum VIT1-VIT3 regions (aligned to chicken) showed significantly higher alignment scores than the genomic background (introns and intergenic regions) in the chain, as assessed by a Mann-Whitney U test (P < 0.05). This suggests that the obtained (pseudogenic) VIT remnants from opossum are nonrandom sequence matches and represent true VIT sequences. In the eutherian [human and dog] comparison, VIT1 coding sequences showed significantly higher scores than the genomic background [reported as P < 0.05 elsewhere] (the alignable regions for the other two VIT genes may be too short to provide statistical significance — VIT3 — or represent spurious matches — VIT2). [Emphasis added.]
There was very little actual sequence alignment data given for the human syntenic regions, just the 150 base sequence from exon 3 that I mentioned in my post. Since I was asked to provide the source of my analysis, here is it, as obtained in the paper in a supplementary figure; again, click on the image to see it better:

Full disclosure: this is the best-reported evidence they have for human synteny. The rest is unconvincing to me, though it may be convincing to others. Surely if they had a better or more extensive alignment they would have reported it. This by the way, I would assume is the stretch of DNA used by Jeff Tomkins in his analysis of the region.
Now for a general comment regarding the accusation of faulty statistics made against me by Torley and Swamidass. Here is the segment from Torley’s post:
Professor Swamidass has two comments which are germane here. First, he points out that as a matter of standard practice, the data relating to similarity in the paper by Brawand et al. should be considered correct, unless proven otherwise. If Dr. Gauger thinks that the authors’ claims of similarity are doubtful, then I would invite her to show the exact DNA sequence she used, so that interested readers can perform a BLAST by themselves (there is a website for this), to verify both the match to the vitellogenin chicken gene and to the human sequence. This doesn’t resolve the issue of picking the right DNA sequence, but it is a start. Selecting the right parameters is important, too: if you use the wrong gapped parameter (a mistake Tomkins is notorious for making), then there will be discrepancies. [Emphasis added.]
I do not question the authors’ data, but I do question their interpretation that it proves there is a VIT1 pseudogene in humans. Actually to be fair, they merely suggest it as evidence. They do not go much further than what I have quoted above: they point out a few deletions held in common by dogs, humans, and armadillo in the 150 base sequence I show above, arguing that they all share common ancestry. The bulk of the paper is about the remnants of opossum and platypus vitellogenin genes, perhaps because they recognize that the evidence is weak for dogs (for which they report no analysis I could find) and humans.
About the data being correct and my questioning it: All scientists are (or should be) taught in graduate school to critically evaluate conclusions. That is not the same as questioning original data, which I do not do. Questioning conclusions, evaluating them carefully to see if they are warranted, is something all scientists should do.
Again, I based my analysis on the data reported in the paper; I did not question the underlying data. The 150 base sequence I talked about was available as a supplementary figure in the paper itself, and I have already shown it to you. Careful reading of Brawand et al. would have revealed it — it is the only sequence reported for human alignments. But since I am asked to provide the sequence I used, here it is. The 50 percent identity that is so disputed was simply calculated based on the percent identical positions for this 150 base alignment. I used the authors’ own data. By the way, nowhere do they report a sequence identity for the region, probably because with poor alignment elsewhere, the percent identity would be considerably lower than 50 percent.
Lastly, I don’t know where Torley’s computer scientist friend Glenn Williamson got his figures, but they do not match the data reported in the paper. Says Williamson:
About 1,500 base pairs can be aligned with around 73% identity. That’s much more than the 150 base pairs that Tomkins chose to focus on. Readers will recall that Tomkins claimed only a 62% identity, even for this short segment. [Emphasis in the original.]
If the alignment was as high as Williamson said over such a long stretch, surely it would have been reported by the authors. It certainly doesn’t agree with the figures I have shown from the original paper itself. (See Figure S1 and S2.) The 150 base alignment shown in figure S2, with its 50 percent identity, is the little segment on the left side of VIT1, directly over exon 3 in Figure S1. There is no other alignment around it, let alone 1500 bases with 73 percent identity. I’ll leave readers to judge whether Williamson’s alignments are valid. But as Torley says, “if you use the wrong gapped parameter then there will be discrepancies.“
Now for why I wrote the post. For this you will have to go to Dr. Dennis Venema’s post that started it all, and which was mentioned earlier. (I do not think it is under the Creative Commons license so I won’t reproduce his figure here.) I want you to compare his “redrawings” of the synteny between humans and chickens in the VIT1, VIT2, and VIT3 genes to the actual data reported in Brawand et al.’s paper. Does Venema’s redrawing strike you as an exaggeration of the synteny for VIT1, as it did me? Compare it to the figures I have shown here from the original paper.
If all people did was to read Venema’s post, the synteny would look pretty convincing. That’s unfortunate. Those not trained in science will take his post at face value, and be convinced of VIT1 synteny and its status as a former vitellogenin gene. When the original data is examined, it’s not nearly as convincing. Scientists have a duty to represent data accurately, even other people’s data. Now I may not have access to information Dennis Venema has, so I will give him the benefit of the doubt. But I would be happier if he changed his figures, or revealed his source for any data that didn’t come from the paper he cited.
Finally, Torley makes a point about my having commented that the opossum alignment might show synteny better than the human or dog sequence. I didn’t discuss it in my post beyond that comment because it wasn’t the focus of my argument. I will turn to the discussion of the alignment between opossum and other genomes with the chicken, and the evidence for pseudogenes in another post. I will also answer Torley’s question about logical inferences, and offer him my own logical puzzle.
I will deal with his other accusations along the way.
Thanks for sticking with the nitty-gritty analysis, dear readers. It’s up to you to decide what you think about human synteny with VIT genes, whether it is strongly or weakly supported by the evidence, and whether we are justified in considering alternate explanations.
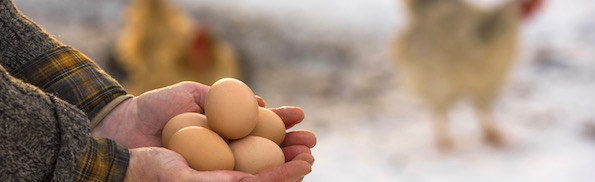
Photo credit: © vbaleha — stock.adobe.com.