 Intelligent Design
 Life Sciences
Model Cell Visualized as a Compact Factory
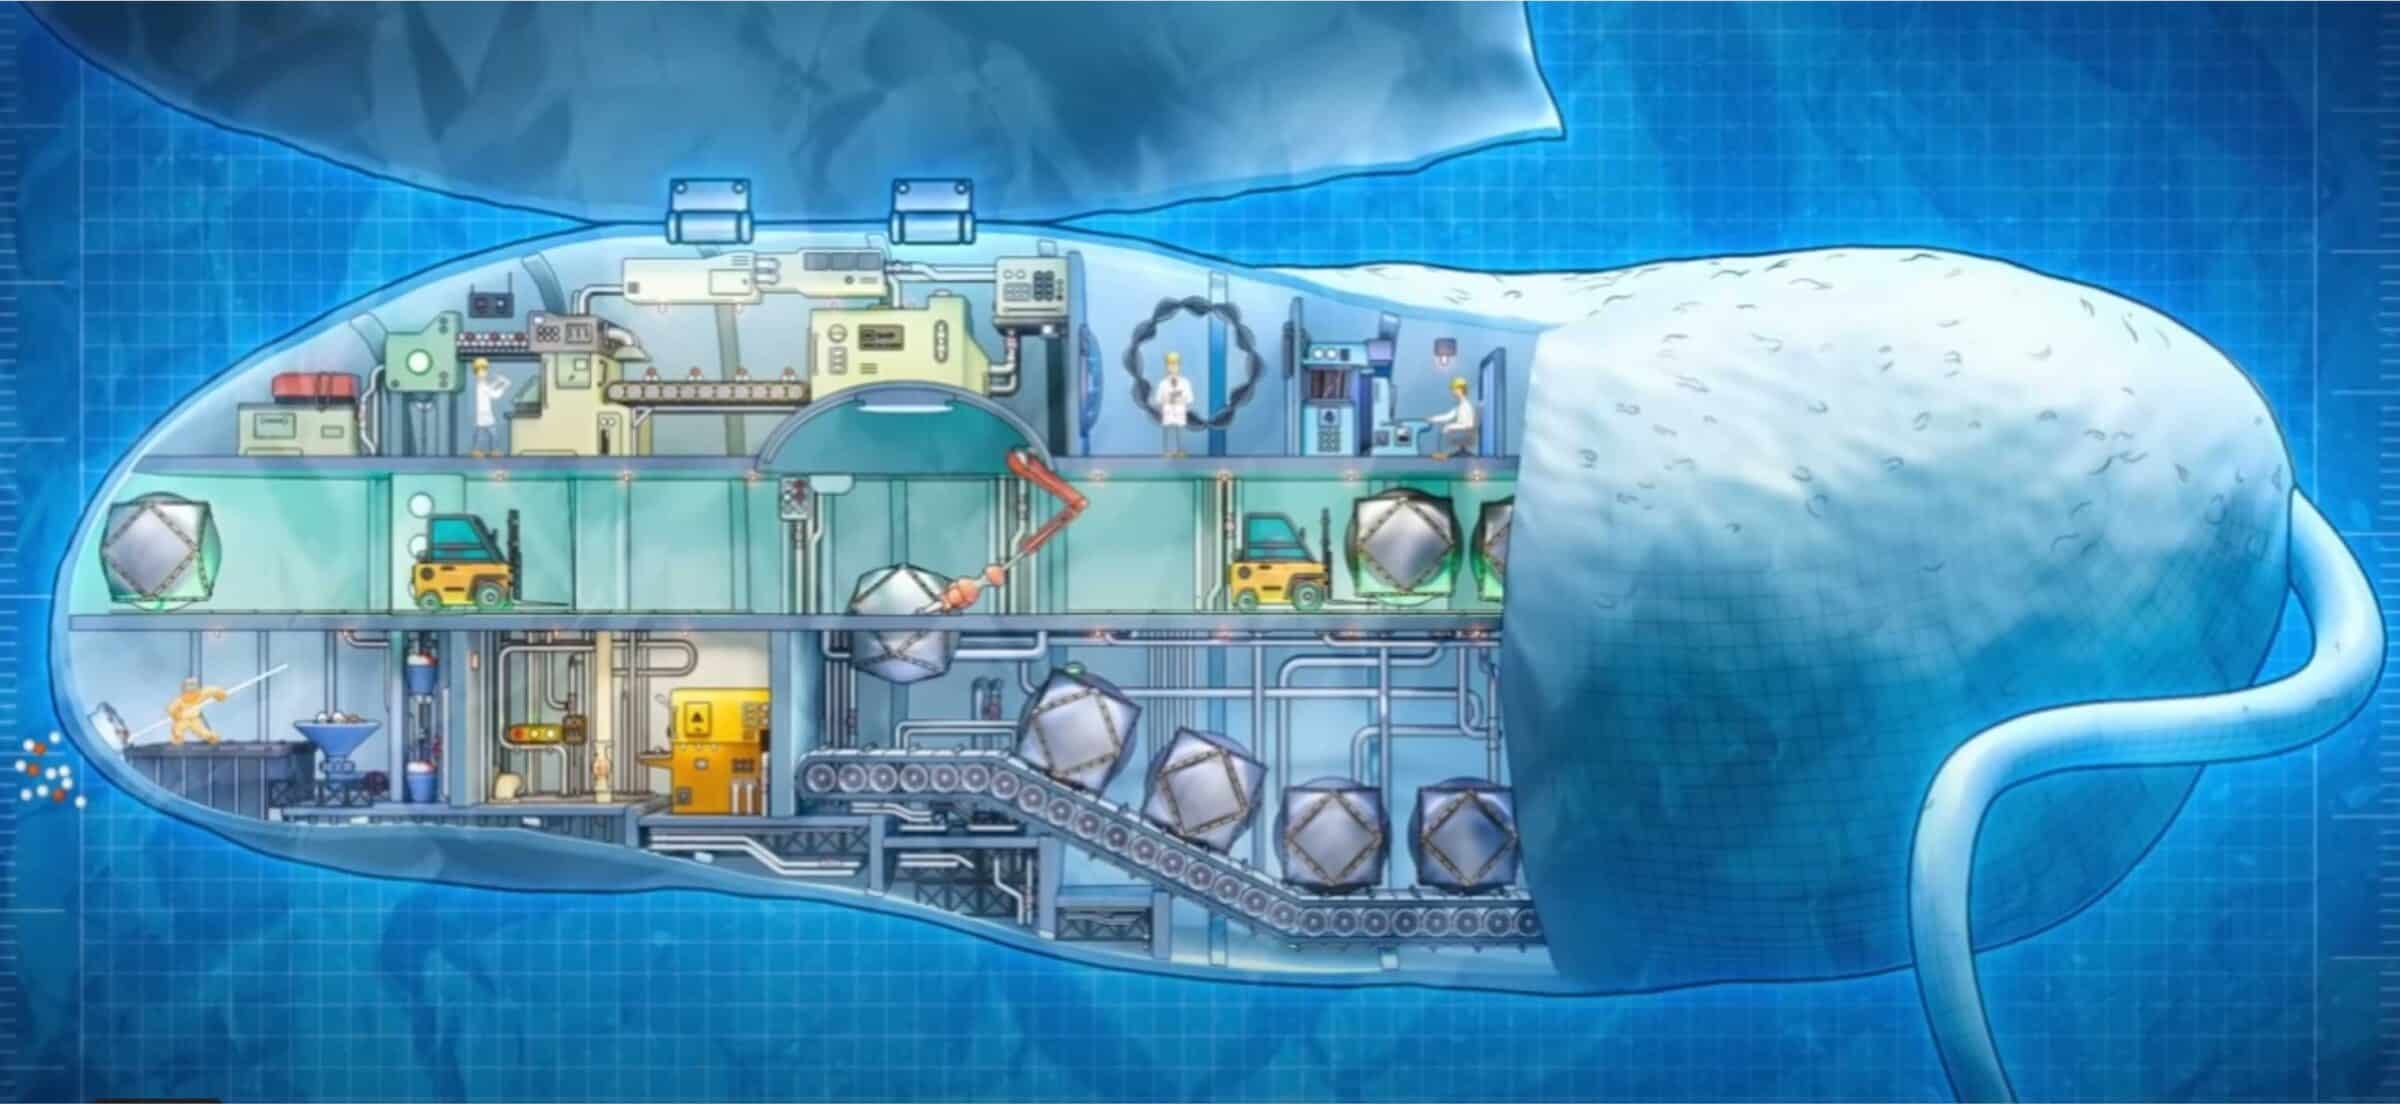
In Episode 6 of Michael Behe’s video series Secrets of the Cell, the animator portrayed little human factory workers, robots, and machines at work inside a magnetotactic bacterial cell. The cartoon characters are seen managing energy production, loading docks with miniature forklifts, coding software, packaging the iron-containing magnetosomes for delivery on conveyor belts, and doing all kinds of things that we can relate to at a human level. Real cells, though they operate with many of the same functional requirements, are squishy. They don’t look like the animation. How can we visualize the innards of a cell in a way that relates the actual appearance to the factory-like operations that go on?
Capturing all the interior parts of a cell in their complex relationships took a lot of work, but some researchers have set a new high bar for biophysical imaging. The Allen Institute in Seattle issued news on April 1 that describes their work visualizing the “shape space” of a typical cell. Senior Scientist Matheus Viana explains the thinking:
“We know that in biology, shape and function are interrelated, and understanding cell shape is important to understand how the cells function,” Viana said. “We’ve come up with a framework that allows us to measure a cell’s shape, and the moment you do that you can find cells that are similar shapes, and for those cells you can then look inside and see how everything is arranged.” [Emphasis added.]
Shape Space Is Function Space
The first task of their project was to get the exterior shape nailed down. Identifying the shape of healthy genetically engineered stem cells was not easy, because they are squishy. No two are identical, even when grown under the same conditions. Stem cells in the middle of the epithelial tissue sample have different shapes than those on the edges. Complicating the task further is the fact that not all similar cells are performing the same functions at the same time. Some may be undergoing mitosis when observed; this profoundly affects the cell’s shape.
The researchers found that most of their 215,081 cells were bean-shaped or pear-shaped to various degrees. By measuring the “bean-ness” and “pear-ness” of thousands of cells according to 8 shape criteria, they arrived at an average shape. This allowed them to study the locations of 25 organelles and other interior parts which they followed using fluorescent tags.
The result is the rotating model cell shown in the press release. It bears a distant resemblance to Behe’s compartmentalized factory. Notice their own words revealing similarities:
When they looked at the position of the 25 highlighted structures, comparing those structures in groups of cells with similar shapes, they found that all the cells set up shop in remarkably similar ways. Despite the massive variations in cell shape, their internal organization was strikingly consistent.
If you’re looking at how thousands of white-collar workers arrange their furniture in a high-rise office building, it’s as if every worker put their desk smack in the middle of their office and their filing cabinet precisely in the far-left corner, no matter the size or shape of the office.
One might apply this description to the Behe cell factory image. The control center, import center and delivery center tend to follow a predictable internal organization.
Visualizing Functional Changes During Mitosis
The Allen Institute team’s first dataset comprised a “large baseline population of cells in interphase.” Then, they studied the shapes of cells at the outer edges of epithelial tissues. Both of those datasets involved static images. Things became really interesting when they added the 4th dimension: time. Their crowning achievement was a 3D model incorporating observations of dividing cells — mapping all 25 organelles and structures — during five stages of mitosis. The result is a colorful, interactive “Interactive Mitotic Stem Cell” that biologists will find profoundly interesting to explore at IMSC.AllenCell.org.
I strongly recommend readers spend a little time at the site. It reminds me of a project described in Illustra’s film Metamorphosis, where biologist Richard Stringer took a time series of MRI images of a butterfly chrysalis, sliced them into hundreds of frames, and built a 3D model of what goes on during the transformation from chrysalis to butterfly. Illustra color-coded the structures so that viewers could watch from any angle as the wings take shape, the digestive system gets dramatically rearranged, and all the new organs for the adult are constructed.
Similarly, in the Allen Cell visualization tool, viewers can watch what happens to each organelle during mitosis. This is a much richer experience than students get in high school biology, where the focus is usually on the chromosomes. Now, one can see what happens to the mitochondria, the Golgi apparatus, the nucleolus, the nuclear envelope, lysosomes, gap junctions, actin filaments and everything else during five mitotic stages. Viewers can spin and magnify the cell, switch the 25 organelles on and off, play a rotation animation, and watch the parts in different degrees of detail.
The team noticed that some organelles stay relatively stable during mitosis, migrating to the apical nodes, while others like the nuclear envelope and Golgi undergo dramatic changes, essentially disintegrating and reorganizing into new structures like marching band players in a “scatter” formation. Biology teachers will love this visualization tool. For ID advocates, it opens new opportunities for design-based hypotheses: for instance, what orchestrates each organelle’s particular sequence of changes from one cell into two cells, and what controls their spatial relationships to other organelles?
The Allen team sees their “shape space” tool as a complement to protein-based studies.
Other systematic image-based approaches have catalogued the location of human proteins in several cell types and used the locations of proteins and structures within cells to identify differences in intracellular spatial patterns among cells in distinct states. Our work complements these approaches with its focus on analyses of 3D cell organization at the intermediate level of cellular structures (rather than individual proteins), and on the generation of quantitative measurements of distinct aspects of organization, which enables statistical comparisons and provides a more nuanced, systematic definition of cellular organization and reorganization. Together, these studies bring a crucial missing dimension — that is, the spatiotemporal component — to the single-cell revolution. The full image dataset and analysis algorithms introduced here, as well as all the reagents, methods, and tools needed to generate them, are shared in an easily accessible way (https://www.allencell.org/). These data are available to all for further biological analyses and as a benchmark for the development of tools and approaches moving towards a holistic understanding of cell behaviour.
Having a model of a normal healthy cell digitized in a computer, medical professionals will be able to identify abnormal states earlier. Watch the Darwin-free video “How do you measure a human cell?” to witness the excitement they experienced when their model cell was all put together after seven years of work. And this is just the beginning. The new model was all for one cell type, but a human body has many different cell types acting in multiple situations, subject to different pathologies.
“This study brings together everything we’ve been doing at the Allen Institute for Cell Science since the institute was launched,” said Ru Gunawardane, Ph.D., Executive Director of the Allen Institute for Cell Science. “We built all of this from scratch, including the metrics to measure and compare different aspects of how cells are organized. What I’m truly excited about is how we and others in the community can now build on this and ask questions about cell biology that we could never ask before.”
Viana’s very large team published their results open access in Nature on January 4. The only things that “evolved” in the paper were the scientists’ own intelligently designed techniques for imaging and setting up experiments. Everything else was in “machine language”—
Understanding how a subset of expressed genes dictates cellular phenotype is a considerable challengeowing to the large numbers of molecules involved, their combinatorics and the plethora of cellular behavioursthat they determine. Here we reduced this complexity by focusing on cellular organization — a key readout and driver of cell behaviour — at the level of major cellular structures that represent distinct organelles and functional machines, and generated the WTC-11 hiPSC Single-Cell Image Dataset v1, which contains more than 200,000 live cells in 3D, spanning 25 key cellular structures.
The Allen team’s pioneering effort to digitize a 3D normal stem cell undergoing mitosis can now be expanded by other teams who want to investigate other cell types — neurons, muscle cells, erythrocytes, bone cells — in any other organism from microbe to mammal. I’m reminded of pictures of various embryonic mammals in the womb: a giraffe taking shape, an elephant, a mouse. Once the basic sequence of gestation was visualized for the human, it became fascinating to look for similarities and differences in other mammals. Similarly, the Allen project visualizing a “model stem cell” begins what will surely lead to additional models for other cell types.
If, as ID advocates know from experience, specified complexity in biology grows as a function of detail, the future looks bright for design apologetics. Leeuwenhoek would have been amazed.
Anecdote
There’s news about magnetotactic bacteria that Dr. Behe discussed in his video. The Helmholtz Association for German Research Centres reports (via Phys.org) that these microbes can remove heavy metals, including uranium, from wastewater. “Due to their structure, they are positively predestined for such a task,” the article says, noting that they can be easily separated from water using magnets. Notable quotes:
Because they exhibit a feature that differentiates them from other bacteria, magnetotactic bacteria form nanoscopic magnetic crystals within the cell. They are arranged like a row of beads and so perfectly formed that humans would currently be unable to reproduce them synthetically. Each individual magnetic crystal is embedded in a protective membrane.
Together, the crystals and membrane form the so-called magnetosome which the bacteria use to align themselves with the Earth’s magnetic field and orientate themselves in their habitat. It also makes them suitable for simple separation processes.
Magnetotactic bacteria can be found in almost any aqueous environment from fresh water to saltwater, including environments with very few nutrients. Microbiologist Dr. Christopher Lefèvre has even discovered them in the hot springs of Nevada.